Monthly Review of Macro and Market Performance
- Financial Insights
- Market Insights
Gary Dugan, Chadi Farah, Bill O'Neill
The Global CIO Office
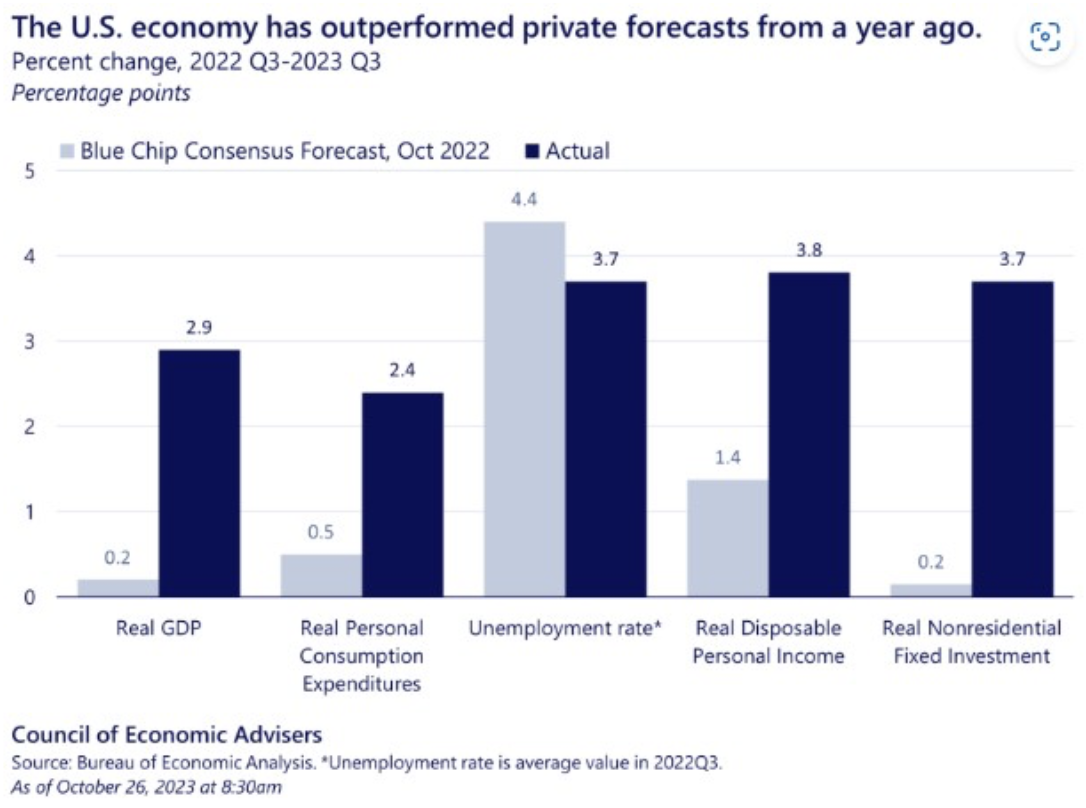
Through October, data reports for the global economy showed stronger-than-expected growth in the United States and some stabilisation in China. Third quarter US GDP growth came in well ahead of expectations at 4.9%. Still, strong consumer spending growth was a positive feature (Chart 1). The sharp increase in inventories means that the headline growth somewhat overstates the underlying strength of the economy. Around 1.3 percentage points of growth came from the build-up inventories, which may reverse in subsequent months. Former investor worries that the US economy faces an imminent recession still seem far from the truth.
Chart 1: Consumer spending growth leading positive surprises in the US economy
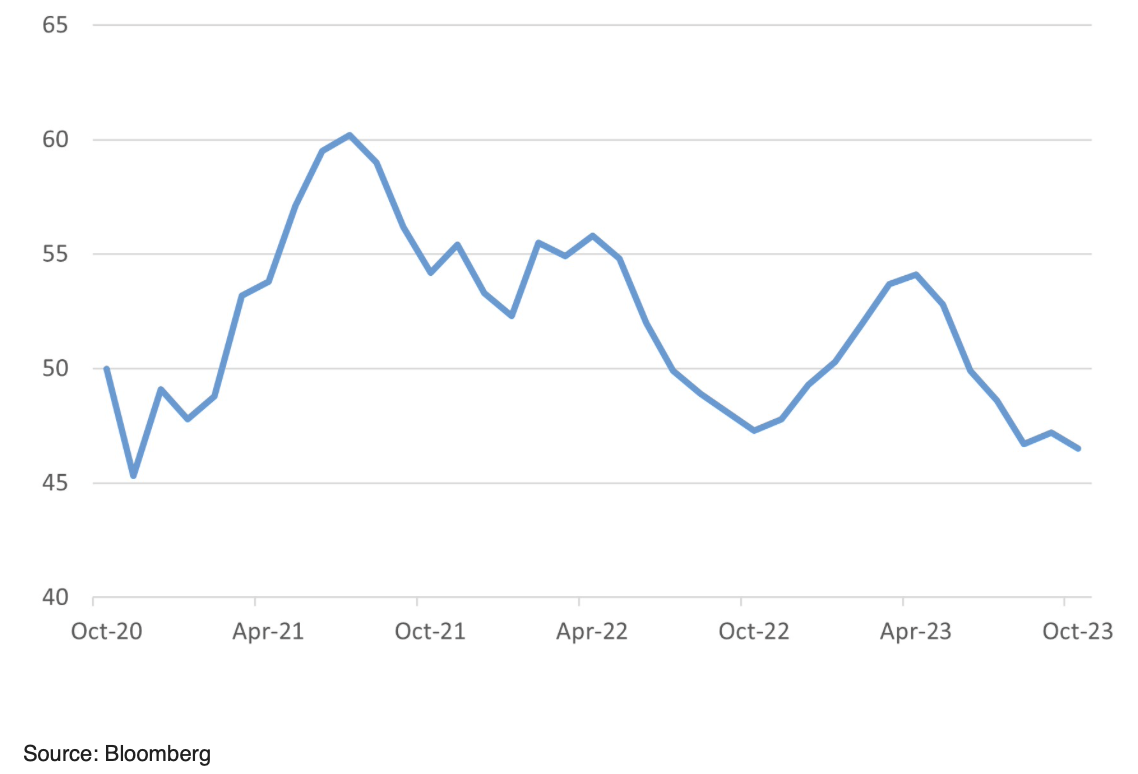
While the US economy grows, Europe stagnates. Initial official estimates for eurozone third quarter growth showed GDP fell 0.1% quarter-on-quarter. The more positive news is that inflation is surprising to the downside. Inflation for September fell to 2.9% from 4.2%, although core inflation at 4.2% remains well above the ECB’s comfort zone. The ECB left interest rates unchanged in October ending a run of 10 consecutive rate hikes.
Chart 2: Eurozone Composite PMI (Index)
50 marks the point demarking growth from contraction
Chinese economy stabilises – hopes for a stronger end to the year
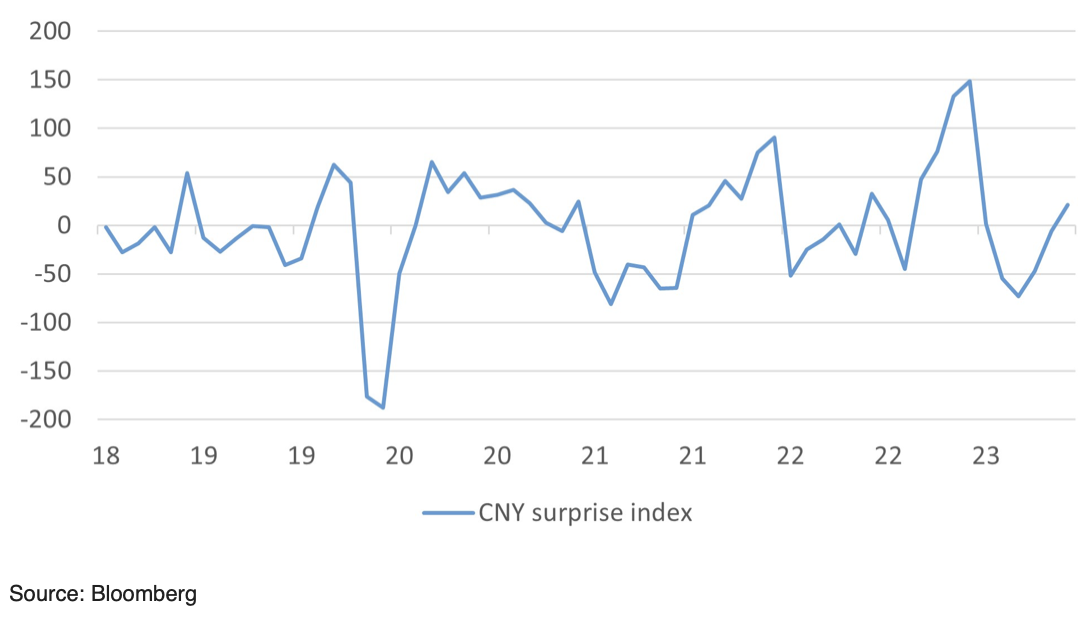
After all of the woes of the Chinese economy in recent months, economic stabilisation was a feature of October. The CESI economic surprise index for China moved above the zero line, implying that the flow of economic data is coming in at or above expectations. To help with funding, the government approved a one trillion yuan ($137 billion) new sovereign bond issue in the fourth quarter. They also allowed local governments to front-load their capital raising for 2024 to front-load potential spending. The central bank also added liquidity to the system to encourage banks to extend credit and maintain low interest rates. Economists expect the additional liquidity to help activity through to the end of the year. As the month closed, the industrial confidence surveys showed the actual activity level was under pressure, with manufacturing sector confidence falling below the 50 mark to 49.4 and confidence in the service sector falling back to 50.6. The market hopes that the measures taken through the month will help the economy to re-accelerate into the end of the year.
Chart 3: Economic surprise for China points to stabilisation
The export orientated Japanese economy, has been impacted by the weakness of global trade. Industrial production growth in September was below expectations at +0.2% month-on-month.
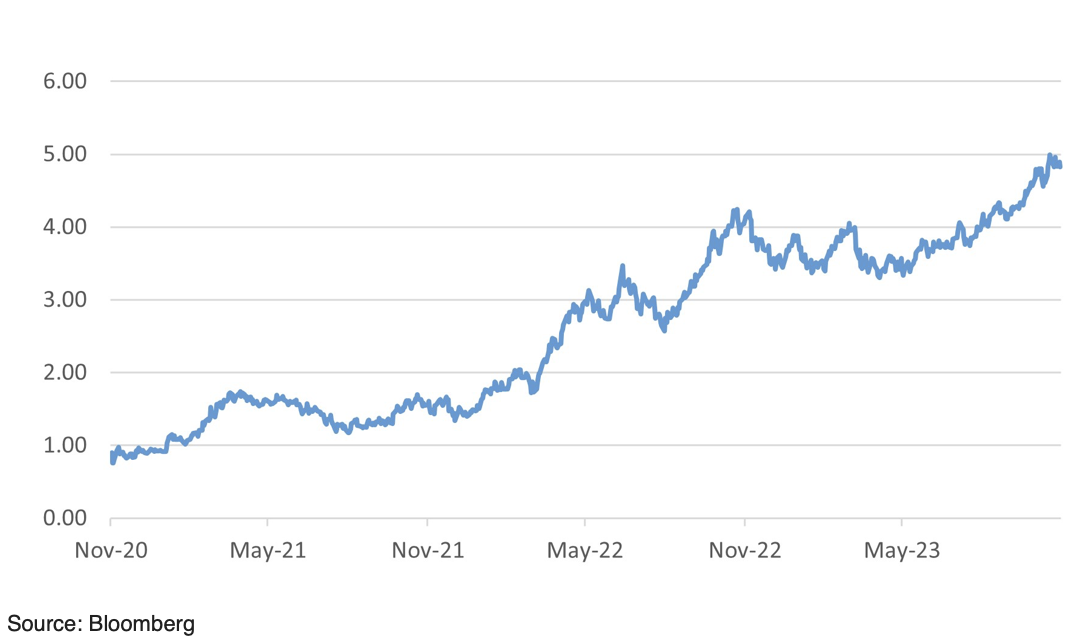
Chart 4: US 10-year bond yield strikes higher to around 5%
Equities
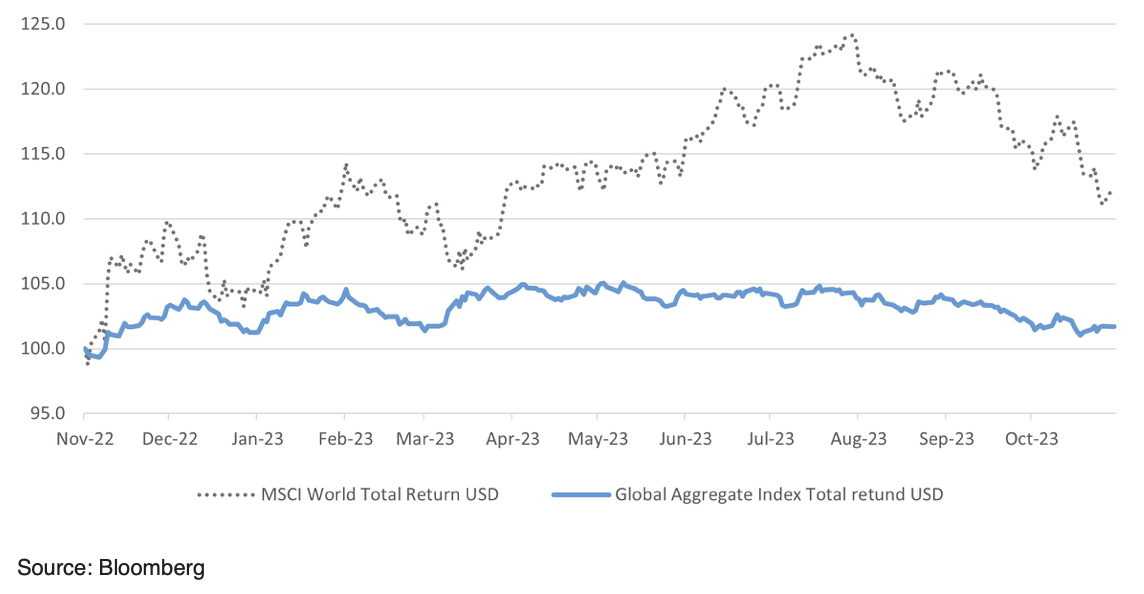
Equity markets started the month on a better note recovering from some of the losses of September. However, as the news from the Middle East came through, investors risk taking retreated and equities sold off. The cause of equities was also not helped by the sharp rise in the US 10-year government bond yield. The relatively narrow dispersion of regional market performances for the month, with emerging markets down 3.2% and the developed markets down 3.3% suggests that the market sell-off was characterised by a general de-risking by investors, rather than a focus on any particular individual market theme.
A callout for the Pakistan equity market which was one of the best performers in October(+12%). A phase of some political stability and an increasing appreciation of July’s agreement with the IMF on a $3bn package of support has helped the currency to rally, taking the edge off the inflation that has plagued the economy. The equity market hit a remarkable six year high.
Table 1: Equity Market returns in October
| US Equities | -3.0% | |
| Europe ex UK | -3.8% | |
| Japan equities | -3.7% | |
| UK equities | -3.5% | |
| Switzerland | -5.3% | |
| Asia ex Japan | -2.9% | |
| Russell 2000 | -7.7% | |
| FTSE Small | -6.5% | |
| India | -2.8% | |
| China | -2.9% | |
| Brazil | -4.0% | |
| Singapore | -4.8% | |
| Emerging markets | -3.2% | |
| Developed Market | -3.3% | |
The energy sector saw profit taking, as the oil price fell back from its highs. Rising long term interest rates hit the banks. The healthcare sector was weaker due to come stock specific issues.
Table 2: Equity market returns by sector in October
| Energy | -4.2% | |
| IT | -1.4% | |
| Consumer staples | -2.0% | |
| Healthcare | -4.5% | |
| Banks | -5.9% | |
Bonds struggled in October with fears of a future rise in oil prices, bringing more inflation risk weighing on bond prices. The US government market was particularly under pressure as stringer than expected growth only added to fears that a further increase in US policy rates could not be ruled out. By contrast, eurozone bonds performed better. The ECB declined to raise rates still further at their meeting after 12 consecutive increases in rates at previous meetings. Also, the weaker data and slightly better inflation performance helped sentiment. There were signs that investors were getting more concerned with the outlook for higher-risk bonds, such as high yields. Spreads started to widen, and for the first time in a while, High-yield bonds underperformed conventional investment grade. Emerging market debt performed a little better than high yield – we still believe that investors are more wedded to holding their positions in emerging markets, given that some countries, such as Brazil and Chile, have already started to cut interest rates.
Table 3: Bond market returns
| Global Aggregate (Hgd) | -0.7% | |
| Investment grade bonds | -1.5% | |
| Emerging market debt | -1.5% | |
| US High Yield | -1.4% | |
Chart 5: Bonds sideways to down and equities giving back their gains
FX and Precious metals
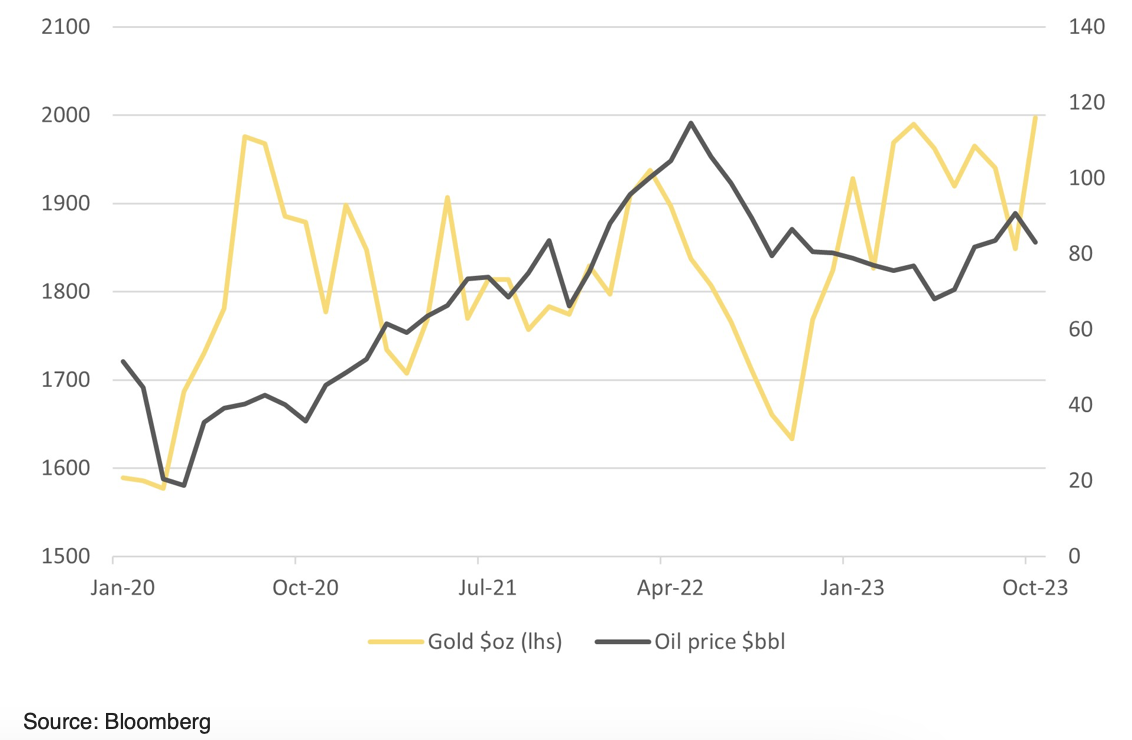
Gold was the best major asset class of the month, with the deteriorating geopolitical situation in the Middle East. The dollar traded sidewards after its recent strong showing.
Table 4: Performance of precious metals and currencies in October
| Gold | 8.0% | |
| Silver | 5.2% | |
| $ trade weighted | -0.1% | |
| GBP trade weighted | -0.5% | |
| Yen/$ | -0.2% | |
Chart 6: Gold hits close to $2000 while oil remains above $80
