
Macro and Markets Monthly July 2023
- Financial Insights
- Market Insights
Gary Dugan, Chadi Farah, Bill O'Neill
The Global CIO Office
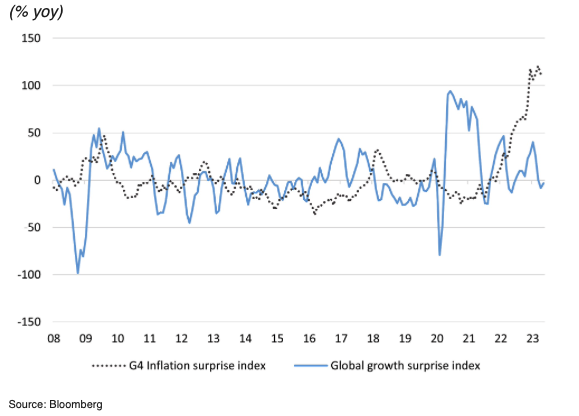
In the early part of the month, the financial markets had fretted that global growth bordered on a mild recession. However, several data points from the US brought comfort. A robust sector quarter GDP report and evidence of a rebound in industrial confidence had economists upgrading their 2023 growth forecasts. Inflation is well off the highs but remains problematic. Although some data points have been better than expected, the aggregate picture is of persistent inflation well ahead of central bank targets. In most cases, central bankers do not see inflation getting back to their targets until the back end of 2024.
Chart 1: Global economic surprise – inflation and growth
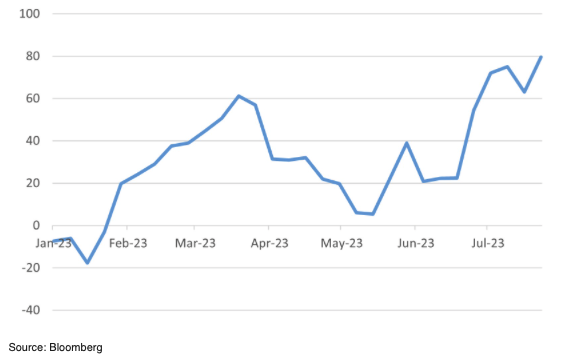
Through July there was remarkable improvement in the momentum of growth in the US economy. Among the major economies the US was the stand out with economic data that came in well ahead of market expectations (Chart 2).
Chart 2: Rise in the US economic surprise index reflects improved outlook for US growth
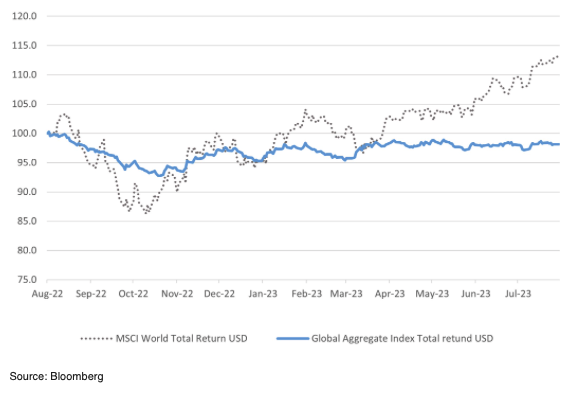
Equities have continued to outperform bonds with government bond yields having upward bias after the stronger than expected growth data. The equity market rally has broadened over the course of the month with some cyclical sectors surpassing the tech sector performance.
Chart 3: Equities leave bond markets behind
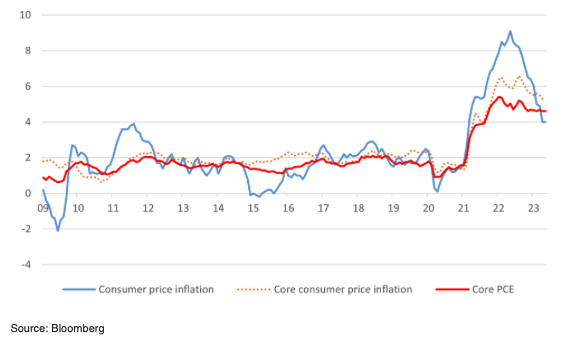
Inflation has dropped back in most parts of the world although core inflation remains higher than the central bankers would like. The Fed, ECB and Bank of Japan all tightened monetary policy through the course of July much as the market expected. In the emerging markets there are hopes that some countries could be delivering their first rate cuts – Brazil and Chile come to mind.
Chart 4: Core US inflation still problematic for the Federal Reserve
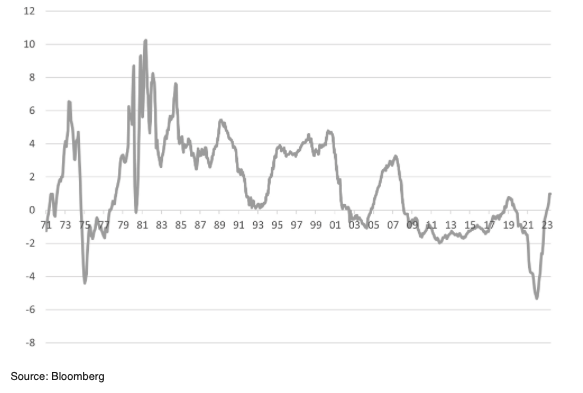
The 25bps increase in the Fed funds rate by the FOMC pushed the real interest rate higher but still not to the level of rates that would typically be seen as restrictive. One further factor to remember is that monetary policy is working against the headwind of very loose fiscal policy in the Fed’s effort to slow US growth. JPMorgan estimates that the US government deficit will increase from $950bn in FY22 to $1.839 trillion in the current fiscal year ending September 30th. The Congressional Budget Office expects the US to run increasing budget deficits of around 6% of GDP over the next two years. Compare that with 2006/7, when the US last tried to rein in inflation, the budget deficit averaged 1.5% of GDP and was declining.
Chart 5: US Fed funds rate deflated by Fed’s preferred measure of inflation (Core PCE deflator)
Markets
Equities had another strong month, with market breadth improving. The US largely led the rally as economic data showed the US economy to have performed much better than previously thought through the second quarter. The only disappointment was the performance of the Japanese equity market, which took a breather after the strong performance in previous months. Despite the Chinese government announcing a promise of support for the economy, the Chinese equity market managed only a modest rebound after some poor performance year-to-date. There is still hope that we will see more substantive support for the economy over the next few months.
Table 1: Equity Market total returns in July (% USD)
| US Equities | 3.2% | |
| Europe ex UK | 3.0% | |
| Japan equities | -0.1% | |
| UK equities | 2.2% | |
| Switzerland | 0.3% | |
| Asia ex Japan | 5.7% | |
| Russell 2000 | 6.1% | |
| FTSE Small | 3.2% | |
| India | 2.8% | |
| China | 2.8% | |
| Brazil | 3.3% | |
| Singapore | 5.2% | |
| Emerging Markets | 5.8% | |
| Developed Markets | 3.3% | |
Source: Bloomberg
For a change the tech sector took a back seat in terms of market performance. The energy sector rebounded sharply after the sector’s poor performance in June. The oil price rebound of 14% for the month after upgrades to demand growth and OPEC+ sticking to its production cuts all helped. Banks were a standout with investors believing they would benefit from the further rate rises pushed through by central banks. The banks were also helped by evidence that the risk of a global recession was much diminished.
Table 2: Equity Market returns by sector in July
| Energy | 6.4% | |
| IT | 2.7% | |
| Consumer staples | 1.7% | |
| Healthcare | 1.2% | |
| Banks | 8.0% | |
Source: Bloomberg
Bond Markets
High quality bonds continued to struggle to make much headway as central bankers continued to increase interest rates. Emerging market bonds fared better, as some of the individual countries moved closer to putting through their first interest rate cuts. High yield continues to perform well as the risks of a recession abated. The high yield market looks relatively fully valued but spreads could potentially fall a further 100bps taking them to the lows of 2021.
The US 10-year bond yield has crept back towards to 4.0% level over the course of the month reminding investors that inflation still remain problematic, and growth is robust. We would not rule out still higher long term bond yields in the absence of a marked downturn in growth.
Table 3: Bond market returns for July
| Global Aggregate (Hgd) | 0.0% | |
| Investment grade bonds | 0.4% | |
| Emerging market debt | 1.2% | |
| US High Yield | 1.4% | |
Source: Bloomberg
FX and Precious metals
The dollar recovered from some marked weakness at the start of the month o end down just one percent for the month. Despite the shift in the Banks of Japan’s monetary policy framework, allowing the 10 -ear JGB yield to increase as high as 1%, the Yen still ended the month lower. Sterling continued its recovery against the dollar from its lows of last year ($1.05). It briefly pushed above $1.30 on an assumption that the Bank of England would push on with significant rate rises through the balance of the year.
The gold price took its lead from the modest weakness of the dollar. Silver was better bid as the fundamental shortages of supply of the metal helped push the price strongly higher.
Table 4: Monthly performance of precious metals and currencies for June
| Gold | 2.4% | |
| Silver | 8.7% | |
| $ trade weighted | -1.0% | |
| GBP trade weighted | 0.3% | |
| Yen/$ | -1.4% | |

