
Steady But Not Stable
- Market Insights
- Financial Insights
- We highlighted last week that the economic data flow could not stay at neutral
- In the US consumer spending surprises to the upside as does consumer confidence
- The UK sees an unfortunate spike in inflation
- Oil risk about balanced, in a complicated market
- Global bond markets witness a sharp rise in yields in recognition that central bankers are not minded to playing ball on rate cuts yet
Gary Dugan, Chadi Farah, Bill O'Neill
The Global CIO Office
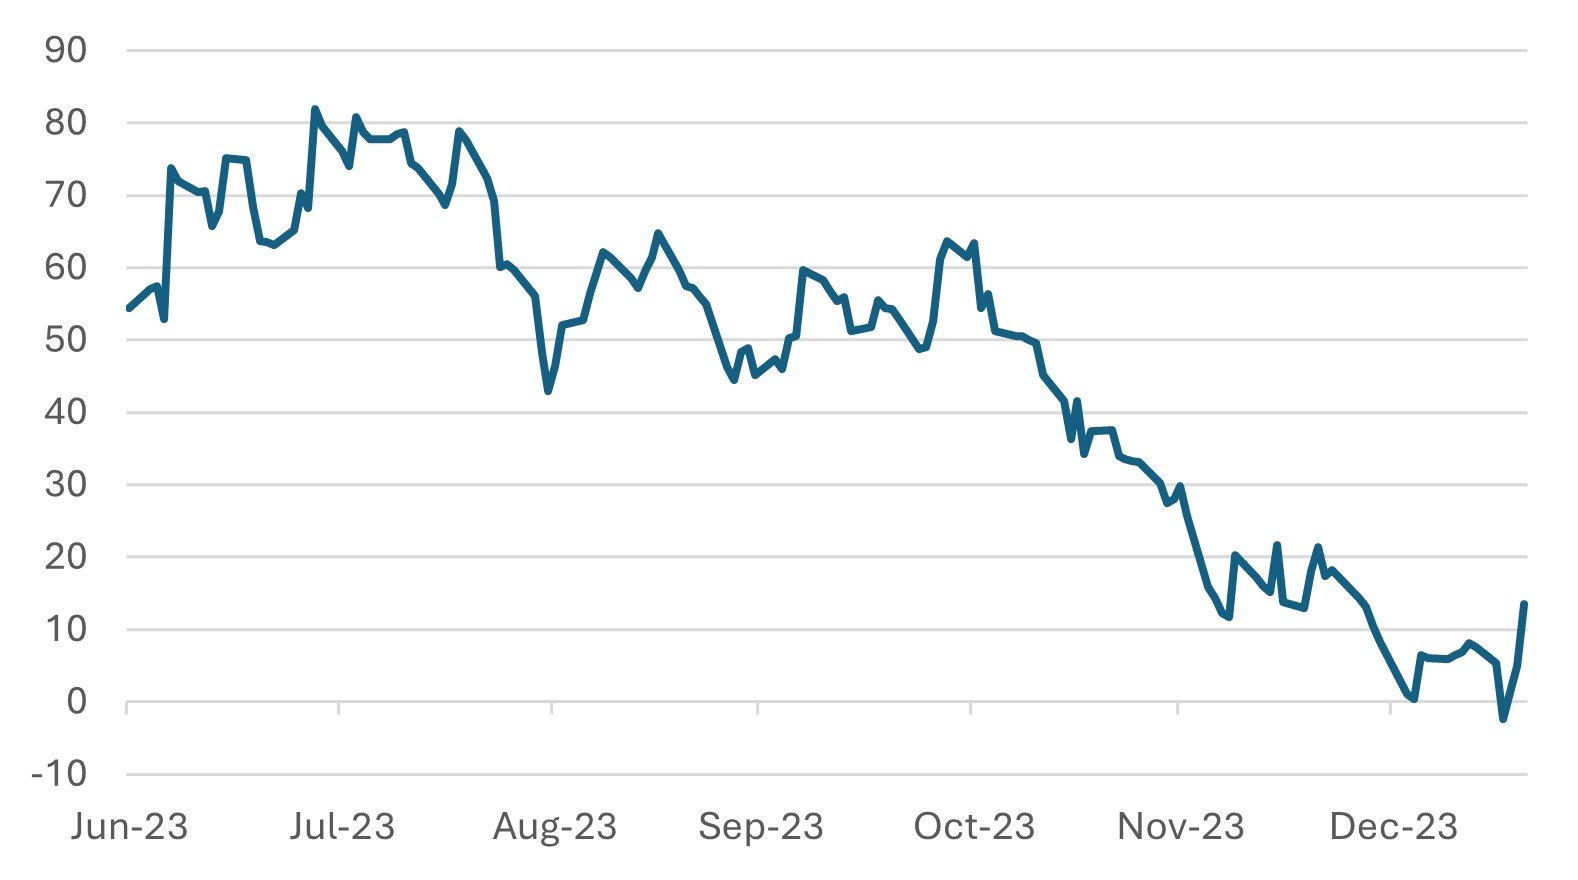
A world of no surprises cannot last forever and we had said so last week. Indeed, this past week, several economic data points in the US marched into the positive territory, suggesting better momentum than many economists had expected. The Citigroup economic surprise index bounced off zero to its best level in around a month. It is encouraging that the index is no longer at neutral!
Chart 1: US Economic Surprise Index Turns Positive from Neutral
Source: Bloomberg
As we had forecast last week, consumer confidence data indicated that retail sales could surprise on the upside, and so it came to pass. Retail sales were significantly ahead of expectations, with the so-called control group showing a 0.8% monthly increase in sales compared with market expectations of +0.2%. On Friday, the University of Michigan Consumer Sentiment Index, a monthly survey of US consumer confidence, matched the Conference Board with a big surprise to the upside. The Survey’s reading – at 78.8 for January – was at the highest since July 2021. Economists have underestimated the shape of the labour market and the fact that consumers are buoyed by good real wage growth and a material drop in mortgage interest rates.
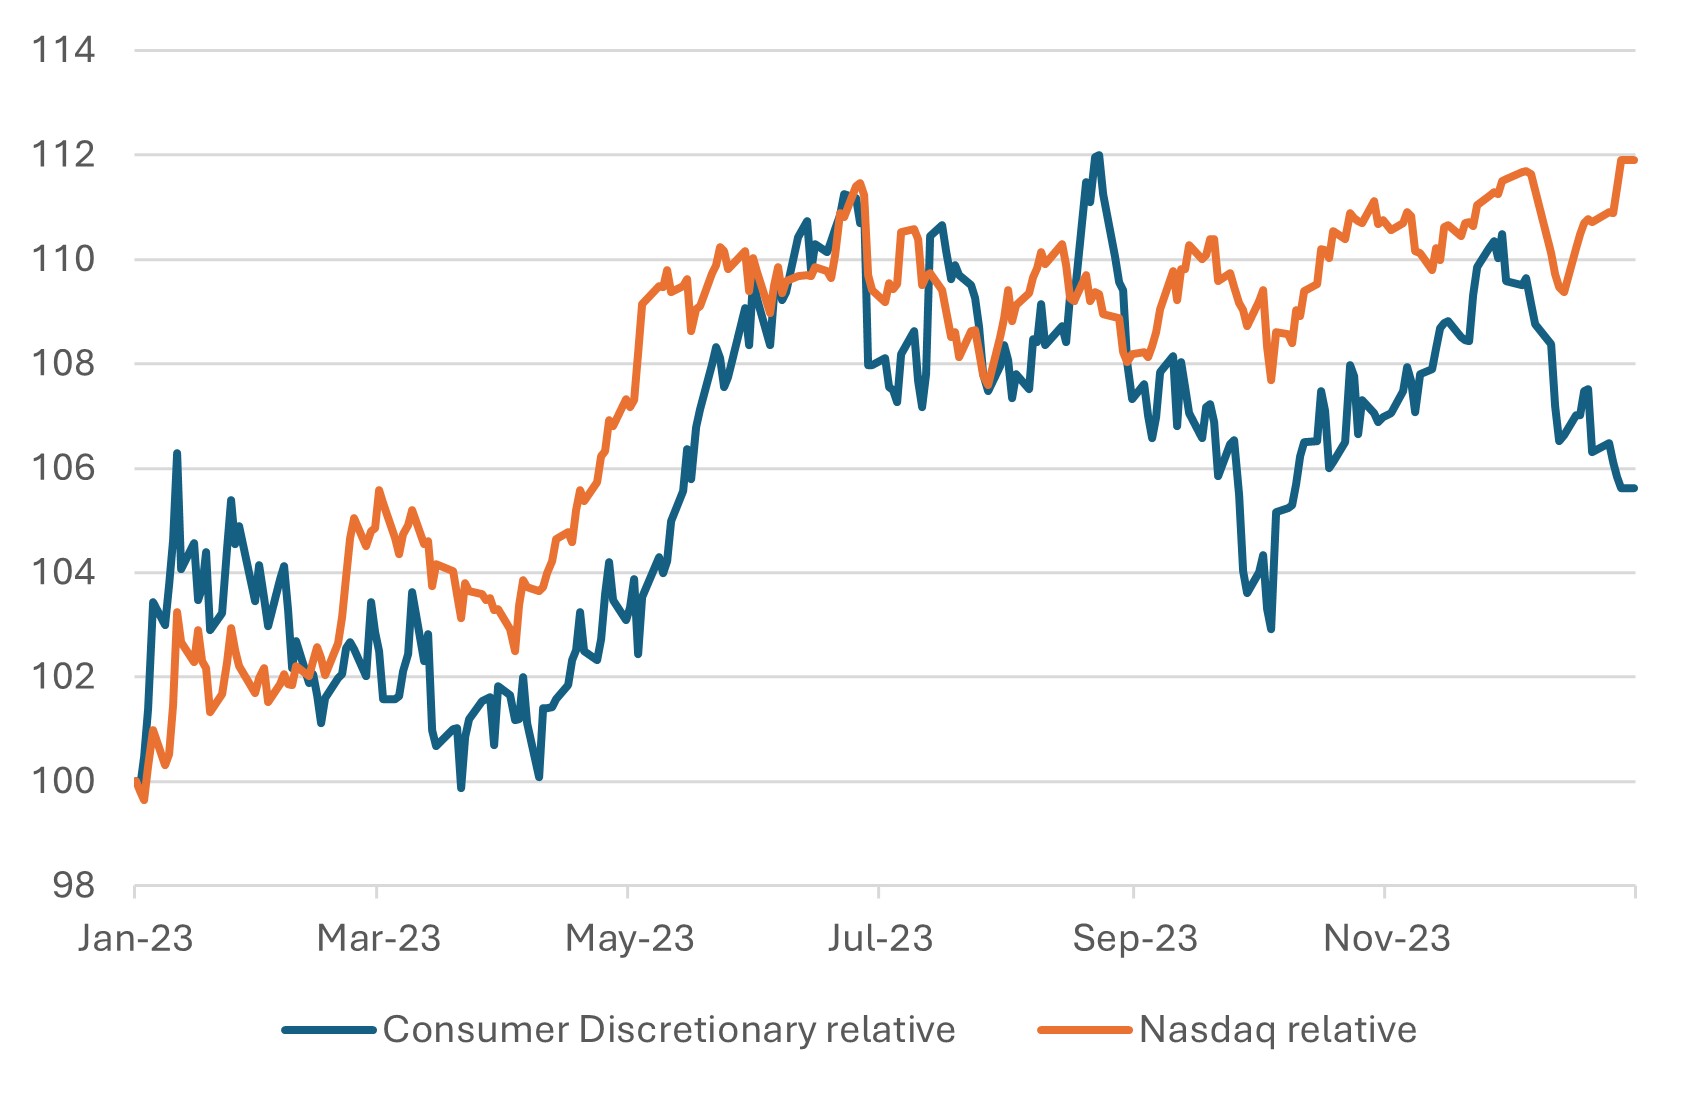
However, despite the better consumer news, the market preferred to load up on technology shares than accumulating consumer discretionary (Chart 2). The rally in technology shares was all the more surprising given the near 20 bps increase in the 10-year government bond yield in the US.
Chart 2: Positive Surprises on Consumer Confidence—Investors Prefer Tech to Consumer Discretionary
UK surprises with higher-than-expected inflation
The surprises last week were not all positive though. Bond markets in the UK experienced some high volatility because of an unexpected increase in inflation, mirroring trends in the US and the eurozone. The headline Consumer Price Index (CPI) increased to 4% year-on-year in December, up from 3.9% in November, and surpassing analysts’ projection of 3.8%. This was the first increase in the rate of inflation in ten months. Primary contributors to this rise were unforeseen hikes in alcohol and tobacco prices. Additionally, there was a slight increase in service price inflation, which reached 6.4%, while core inflation remained steady at 5%.
This inflationary spike has had a significant impact on money markets.
Before the release of the data, there was an 80% likelihood of a rate cut in May; that probability, post the release, has dwindled to just about 50% now. However, this shift seems to be more about the timing rather than a change in the overall direction of the monetary policy. The CPI is still at a level lower than the Bank of England’s projections from the November Inflation Report, which anticipated a headline inflation of 4.6% and services inflation of 6.9% by the end of 2023.
Meanwhile, the recent holiday season retail sales report was notably disappointing, suggesting that the economy may already be on course to a shallow recession. Rate cuts before mid-year now seem inevitable. The only potential disruption to this trajectory could be a generous pre-election budget announced on March 5th, though such a move seems unlikely given the lessons learnt during the Truss administration.
Oil – the US holds the balance, unless OPEC reacts
The risks to the oil price may be more balanced than we had previously thought. The notable rise in US oil production keeps the vulnerability of oil prices to geopolitical risks in check. However, OPEC may also be disappointed that oil prices have not firmed up to a higher level, perhaps because US production has continued seizing market share. There is a risk that OPEC will react by pushing prices lower by abandoning the production curbs. If that happens, we could see oil prices falling back to the $45-$50 level, with OPEC hoping that it could reassert its market dominance and push oil prices back to the $80 level, which equates to a breakeven as far as their fiscal spending plans are concerned.
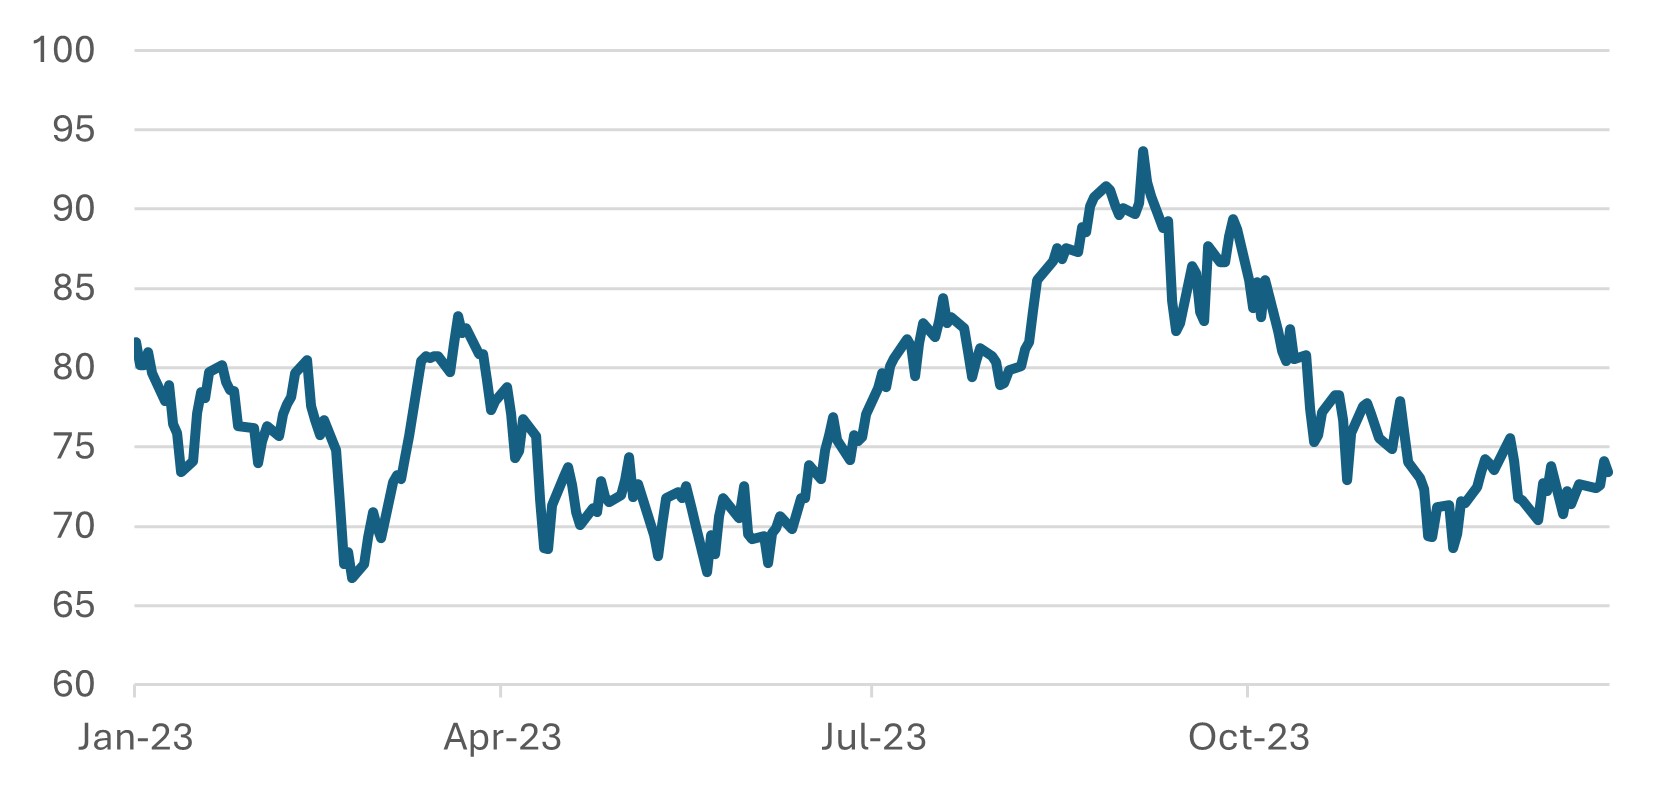
The drop in oil prices has been one of the few sources of good news for global inflation in recent months. While oil prices have firmed up a little, it is strange that they have not risen further, given the rising geopolitical tensions in the Middle East. As stated earlier, the increase in US production has been one factor that has helped keep oil prices in check.
Chart 3: Recent Drop in Oil Prices (WTI $)
Source: Bloomberg
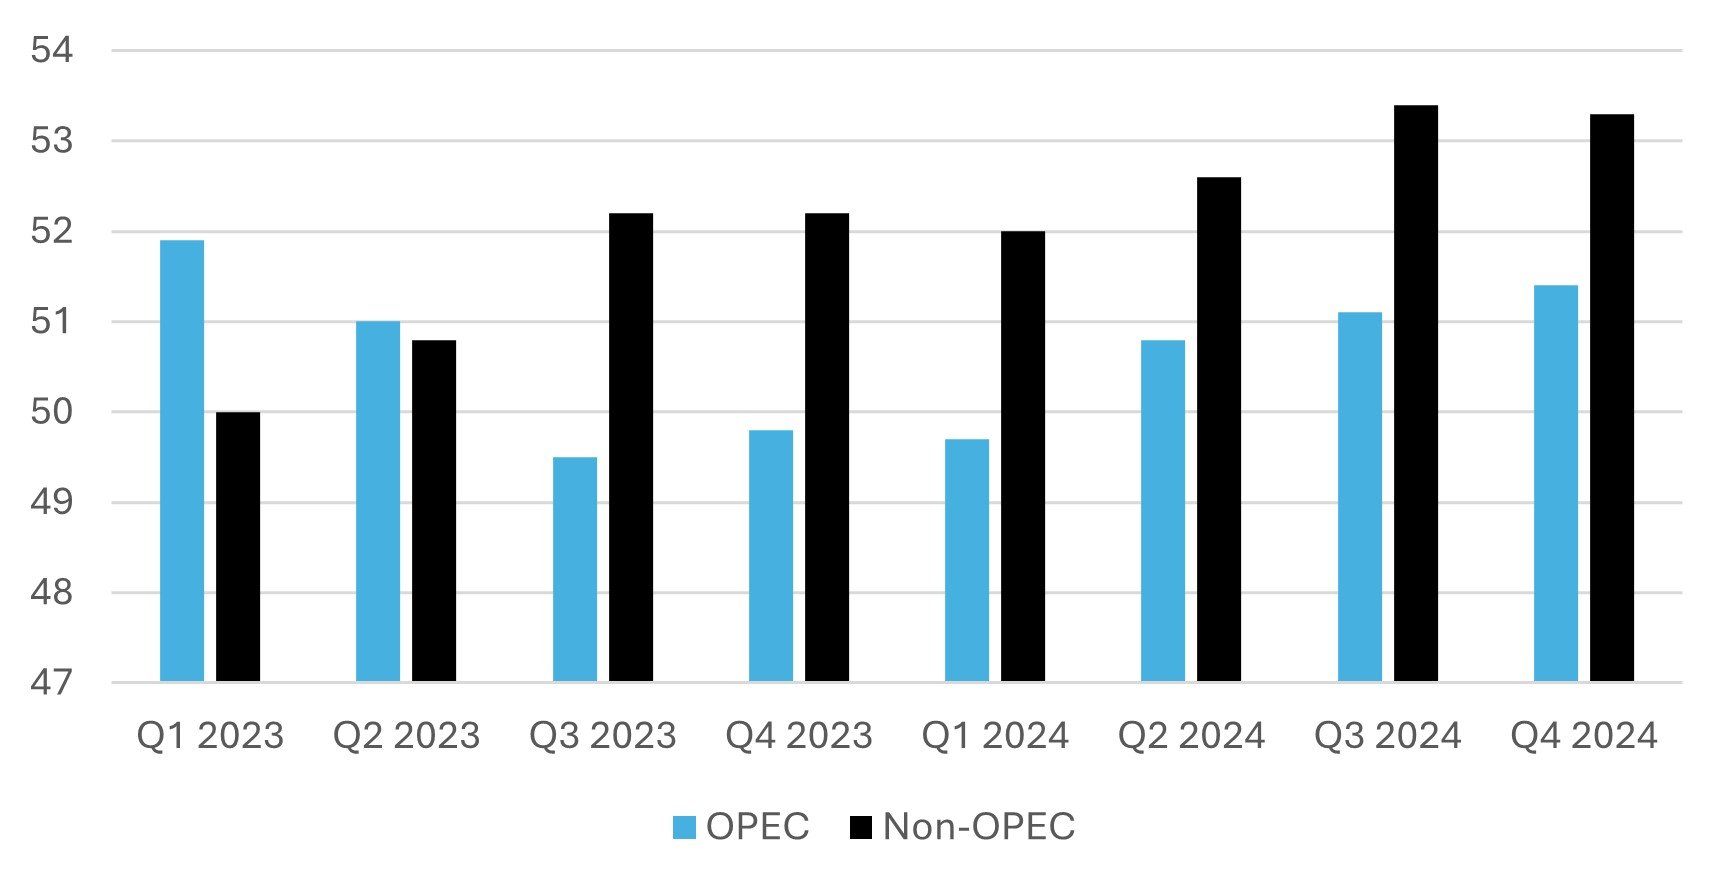
Part of the reason why oil prices have remained in check could be the market’s anticipation that global growth is slowing. However, we believe prices have remained subdued more likely because of the significant growth in non-OPEC oil output, which is likely to persist. Where are oil prices headed then? In our view, it will all depend a great deal on whether the OPEC countries will allow non-OPEC production to continue to take market share.
Chart 4: Non-OPEC Production on the Rise (m b/d)
Source: EIA
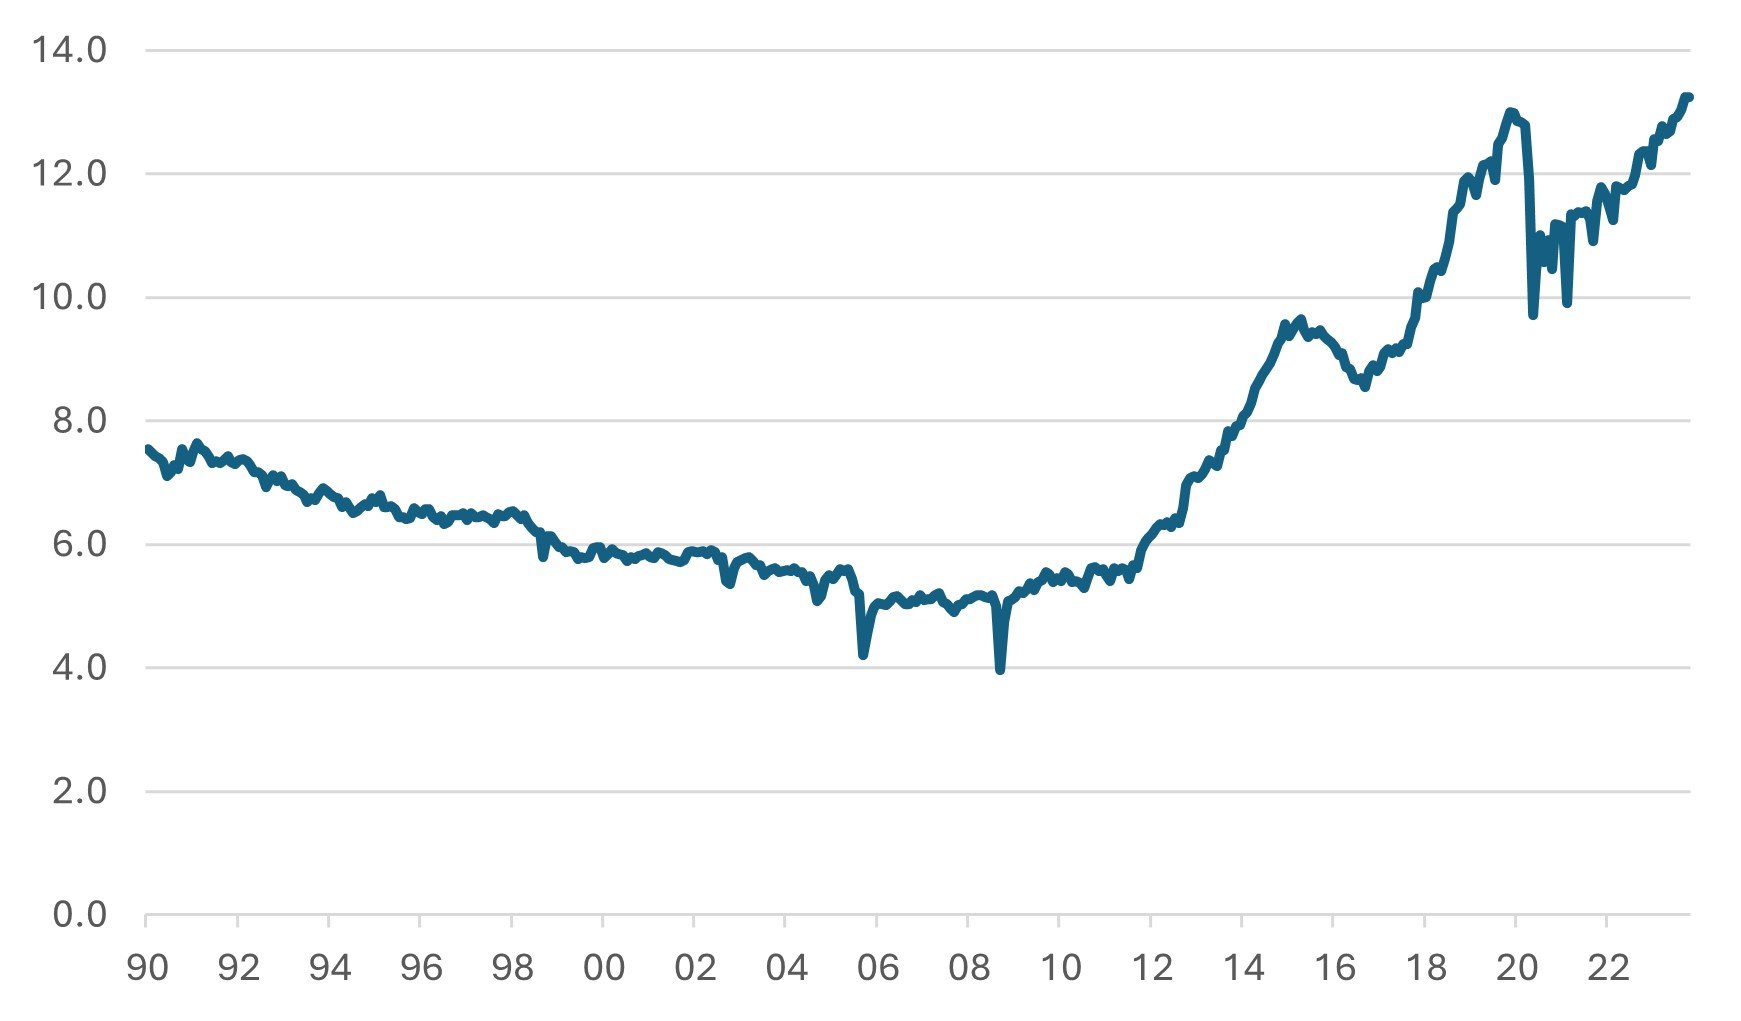
The last time the non-OPEC countries, particularly the United States (onshore market), challenged OPEC was in 2011- 2015. The US shale (fracking) industry was a relatively new phenomenon back then that put a significant number of extra barrels on the market, pushing prices lower. Between the end of 2011 and 2015, US oil production rose 50%. If OPEC lost its patience with the threat of higher US production, it reacted by flooding the market with millions of barrels to push oil prices below the US’ cost of production. The idea – and the effect – was to make US production unprofitable, forcing US companies to reduce production. That effectively put the power back into the hands of OPEC.
Chart 5: US Oil Production Grew Strongly in 2012-15 and has Since Powered on (m/bd)
Source: EIA
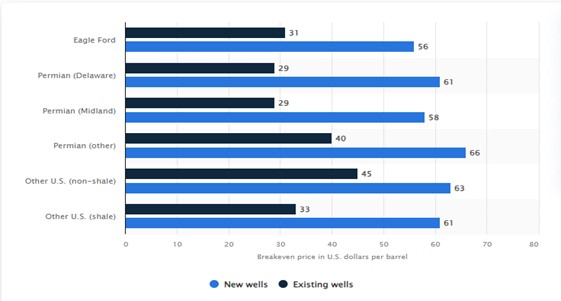
The good news is that the oil market will surely not have to suffer the $105 to $35 reset that we saw in 2014-2016. However, if OPEC is going to try to drive prices below a level that will have an impact on future US production, it will need to cut prices below the $60 mark – the assumed breakeven price of new wells in the US.
Chart 6: Average WTI Oil Price to Breakeven for a Select Group of US Onshore Oil Fields ($bbl)_
Source: EIA
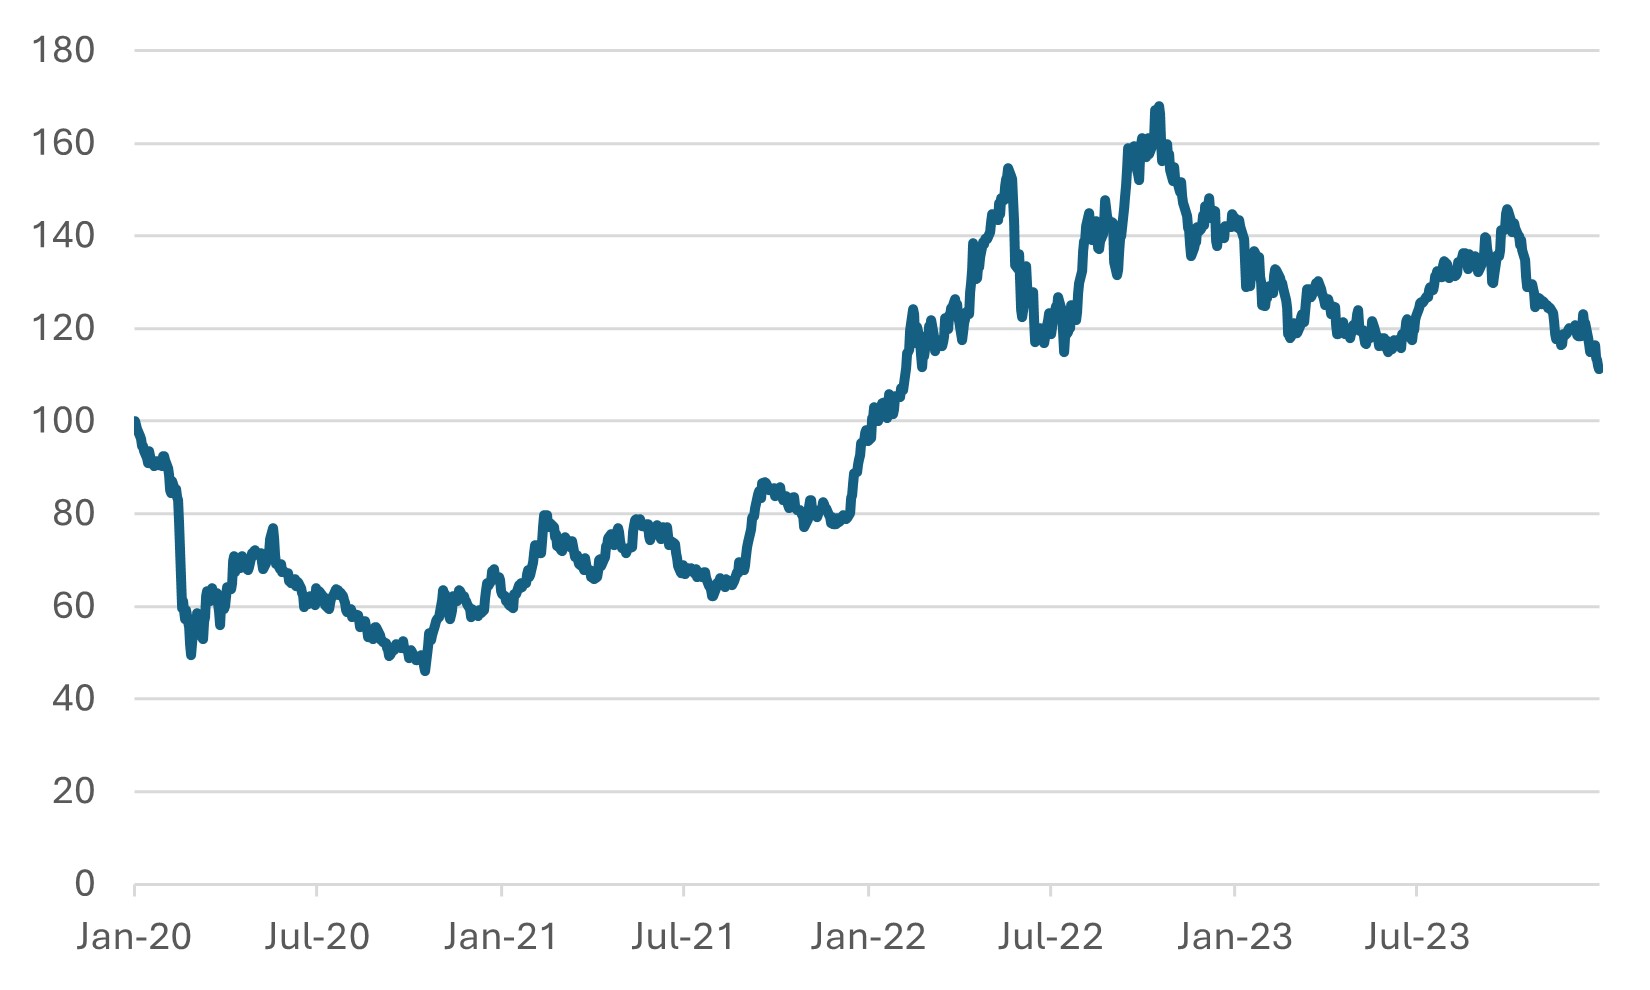
The oil sector price relative has recently dropped to the low end of its recent trading range, seemingly discounting more a negative view of the future path of oil prices. Hence, we are not concerned about the sector’s performance even if oil prices dropped below the $70 level. Considering the current geopolitical risks, we doubt OPEC is minded to increasing production at this stage. In our view, it will instead prefer to accumulate revenues just in case production/deliveries were affected by geopolitical problems.
Chart 7: Relative Performance of Global MSCI Oil Sector to MSCI World
Source: EIA


